Monitor your instances
How to obtain real-time Prometheus metrics from your Stackhero instances
Introduction
Stackhero assists you in retrieving real-time metrics from your instances in Prometheus format. This seamless integration simplifies data visualisation with Grafana dashboards and enables alert triggering using Prometheus (via email, SMS, Slack, Mattermost, and more) for all your Stackhero services in just a few minutes.
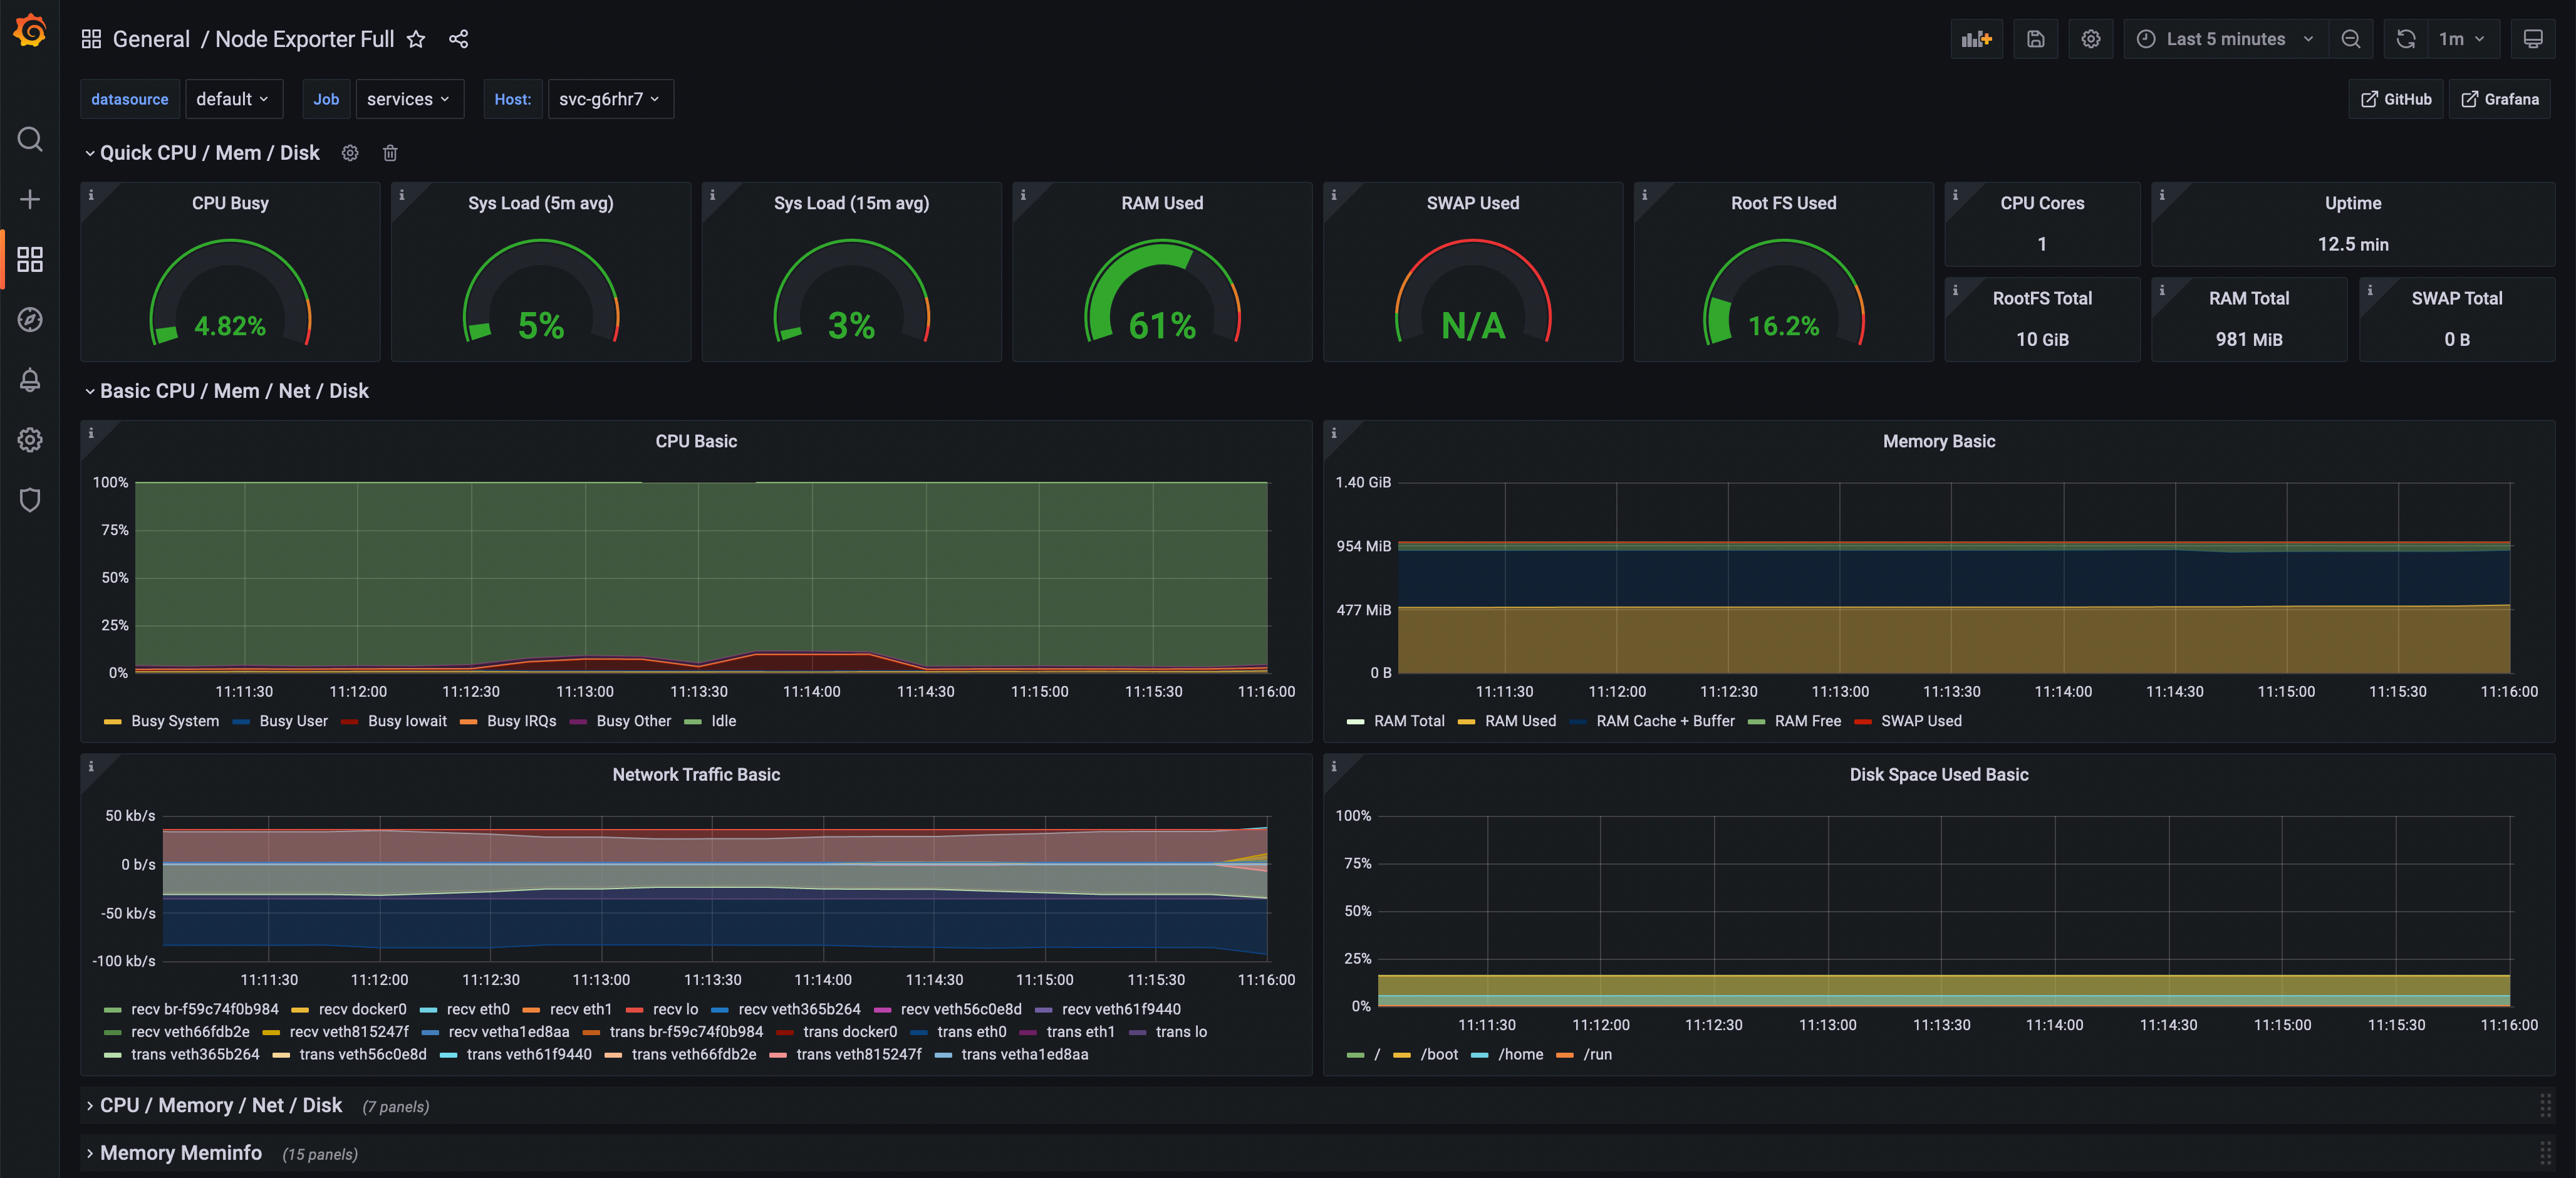 Grafana dashboard showing an instance in real time
How Prometheus metrics work on Stackhero
Stackhero provides a "Service Discovery" HTTP endpoint that returns real-time metrics from your instances in Prometheus format.
Here is the big picture:
- Your Prometheus server connects every 15 seconds to Stackhero's API to retrieve real-time metrics from your instances.
- Your Prometheus server triggers alerts using Alert Manager when defined conditions are met.
- Your Grafana server connects to your Prometheus server to display dashboards that show your Stackhero instances.
Retrieve real-time metrics from your instances
1. Create a token
To start, you need to generate a token that your Prometheus server can use to connect to Stackhero's API.
- Connect to your Stackhero dashboard.
- In the left menu, navigate to
Prometheus. - Click on
Create a token. - Add a description and, if necessary, limit IP access (leave
0.0.0.0/0to allow any IP). - Copy the generated Prometheus configuration.
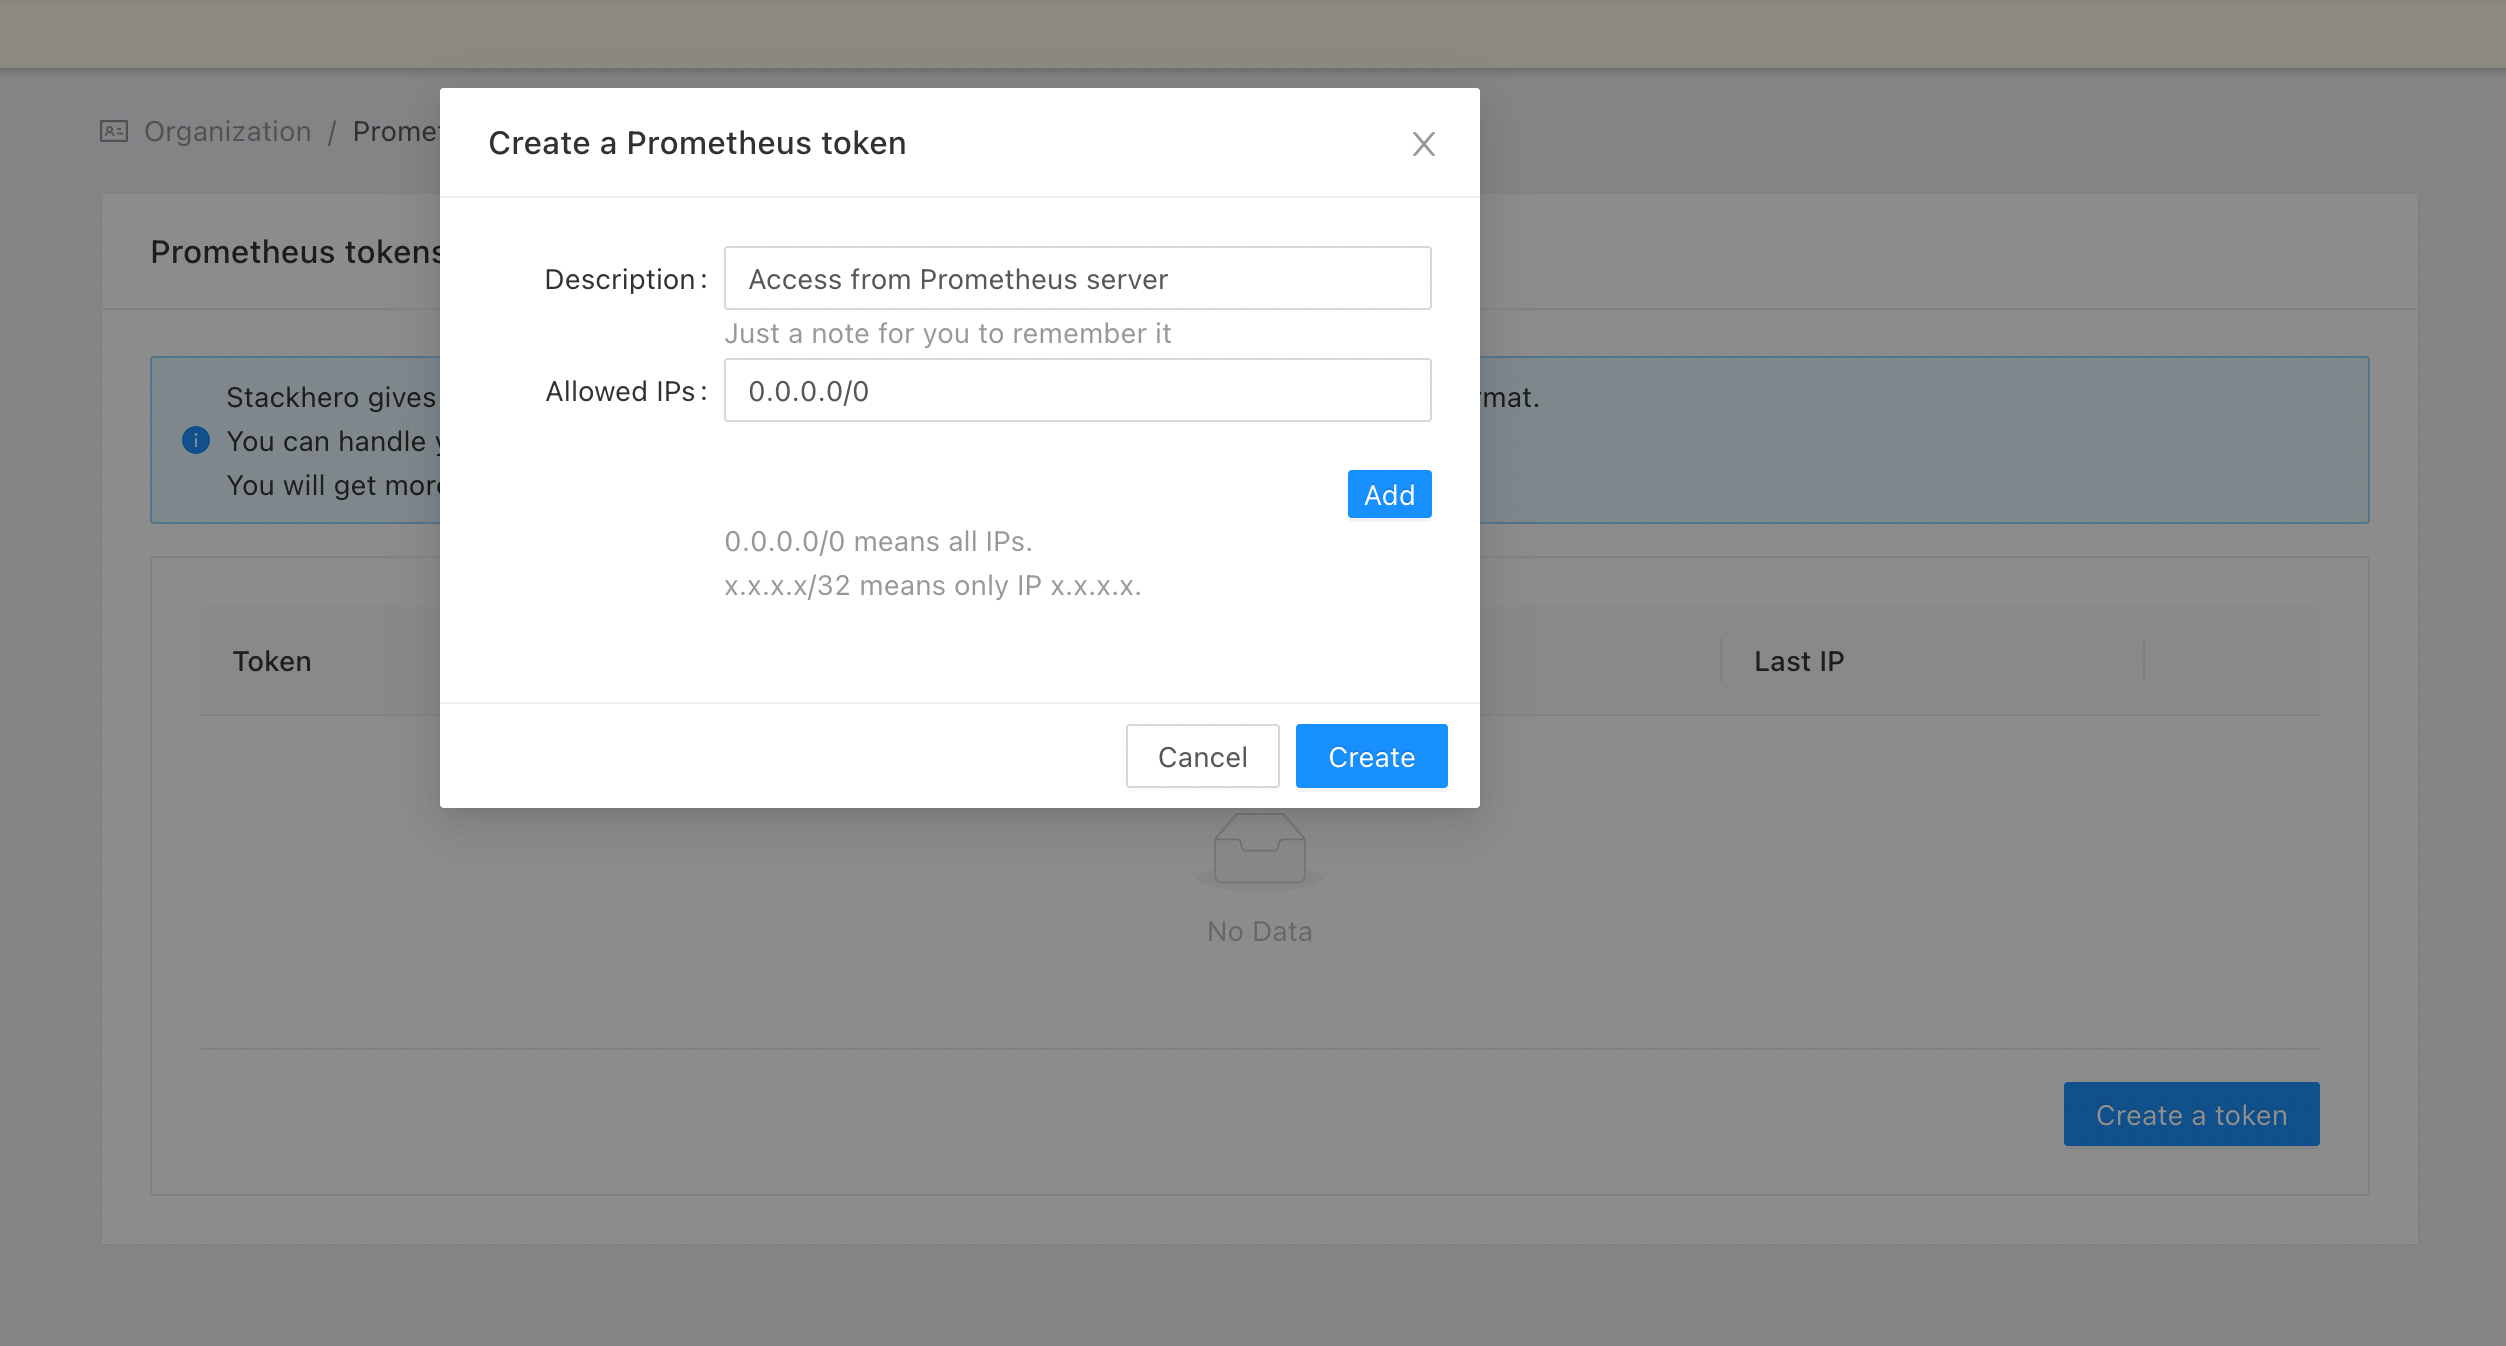 Prometheus token creation in the Stackhero dashboard
2. Configure your Prometheus
Don't have a Prometheus server yet? With Stackhero you can start a managed Prometheus in just 2 minutes!
Open your prometheus.yml configuration file and add the "stackhero" job (previously generated) at the end of the file.
Here is an example configuration:
  - job_name: "stackhero"
    scheme: "https"
    basic_auth:
      username: "<ORGANIZATION_ID>"
      password: "<TOKEN>"
    http_sd_configs:
    - url: "https://api.stackhero.io/v1/prometheus/targets"
      refresh_interval: "15s" # Do not set it to less than 15 seconds!
      basic_auth:
        username: "<ORGANIZATION_ID>"
        password: "<TOKEN>"
3. Verify that Prometheus retrieves the metrics
Navigate to your Prometheus dashboard and go to Status > Service Discovery. You should see a "stackhero" service discovery entry registered.
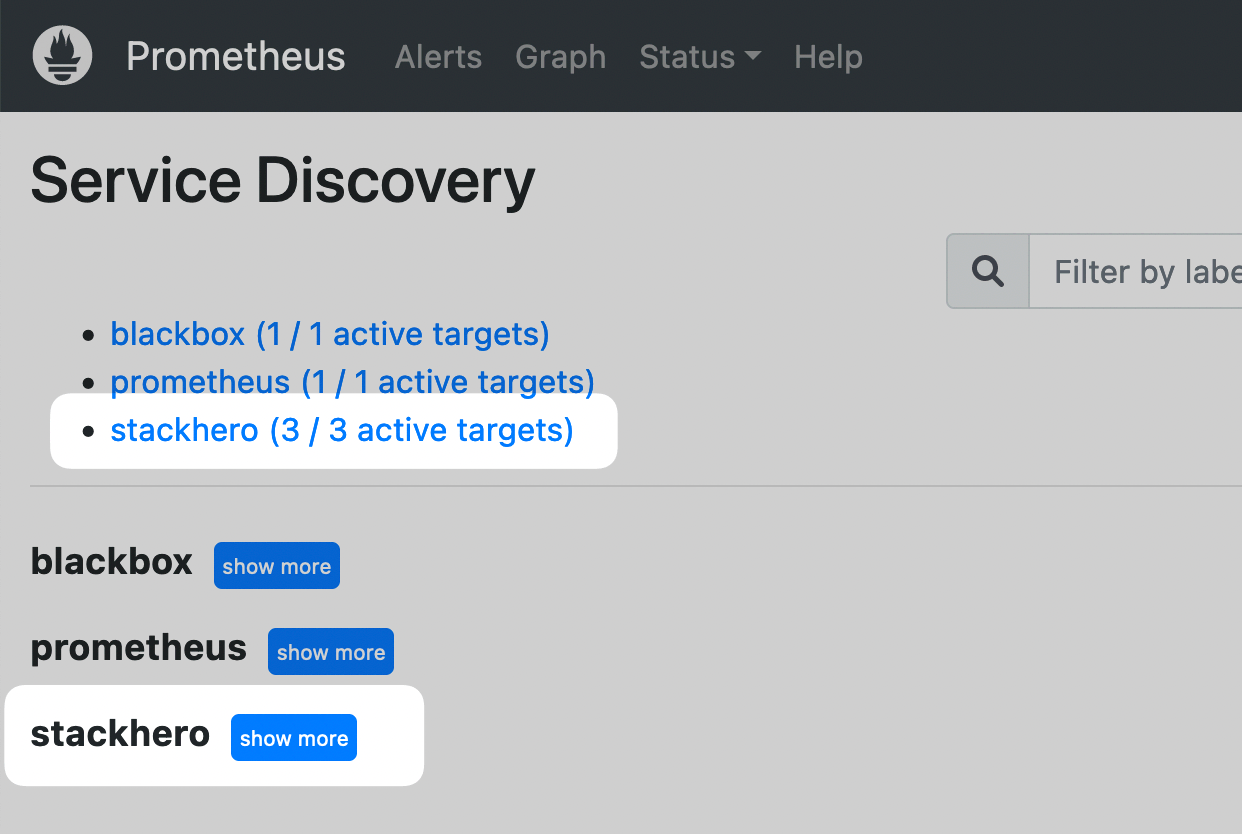 Prometheus dashboard showing Stackhero service discovery
Next, go to Status > Targets. You should see one endpoint for each Stackhero instance.
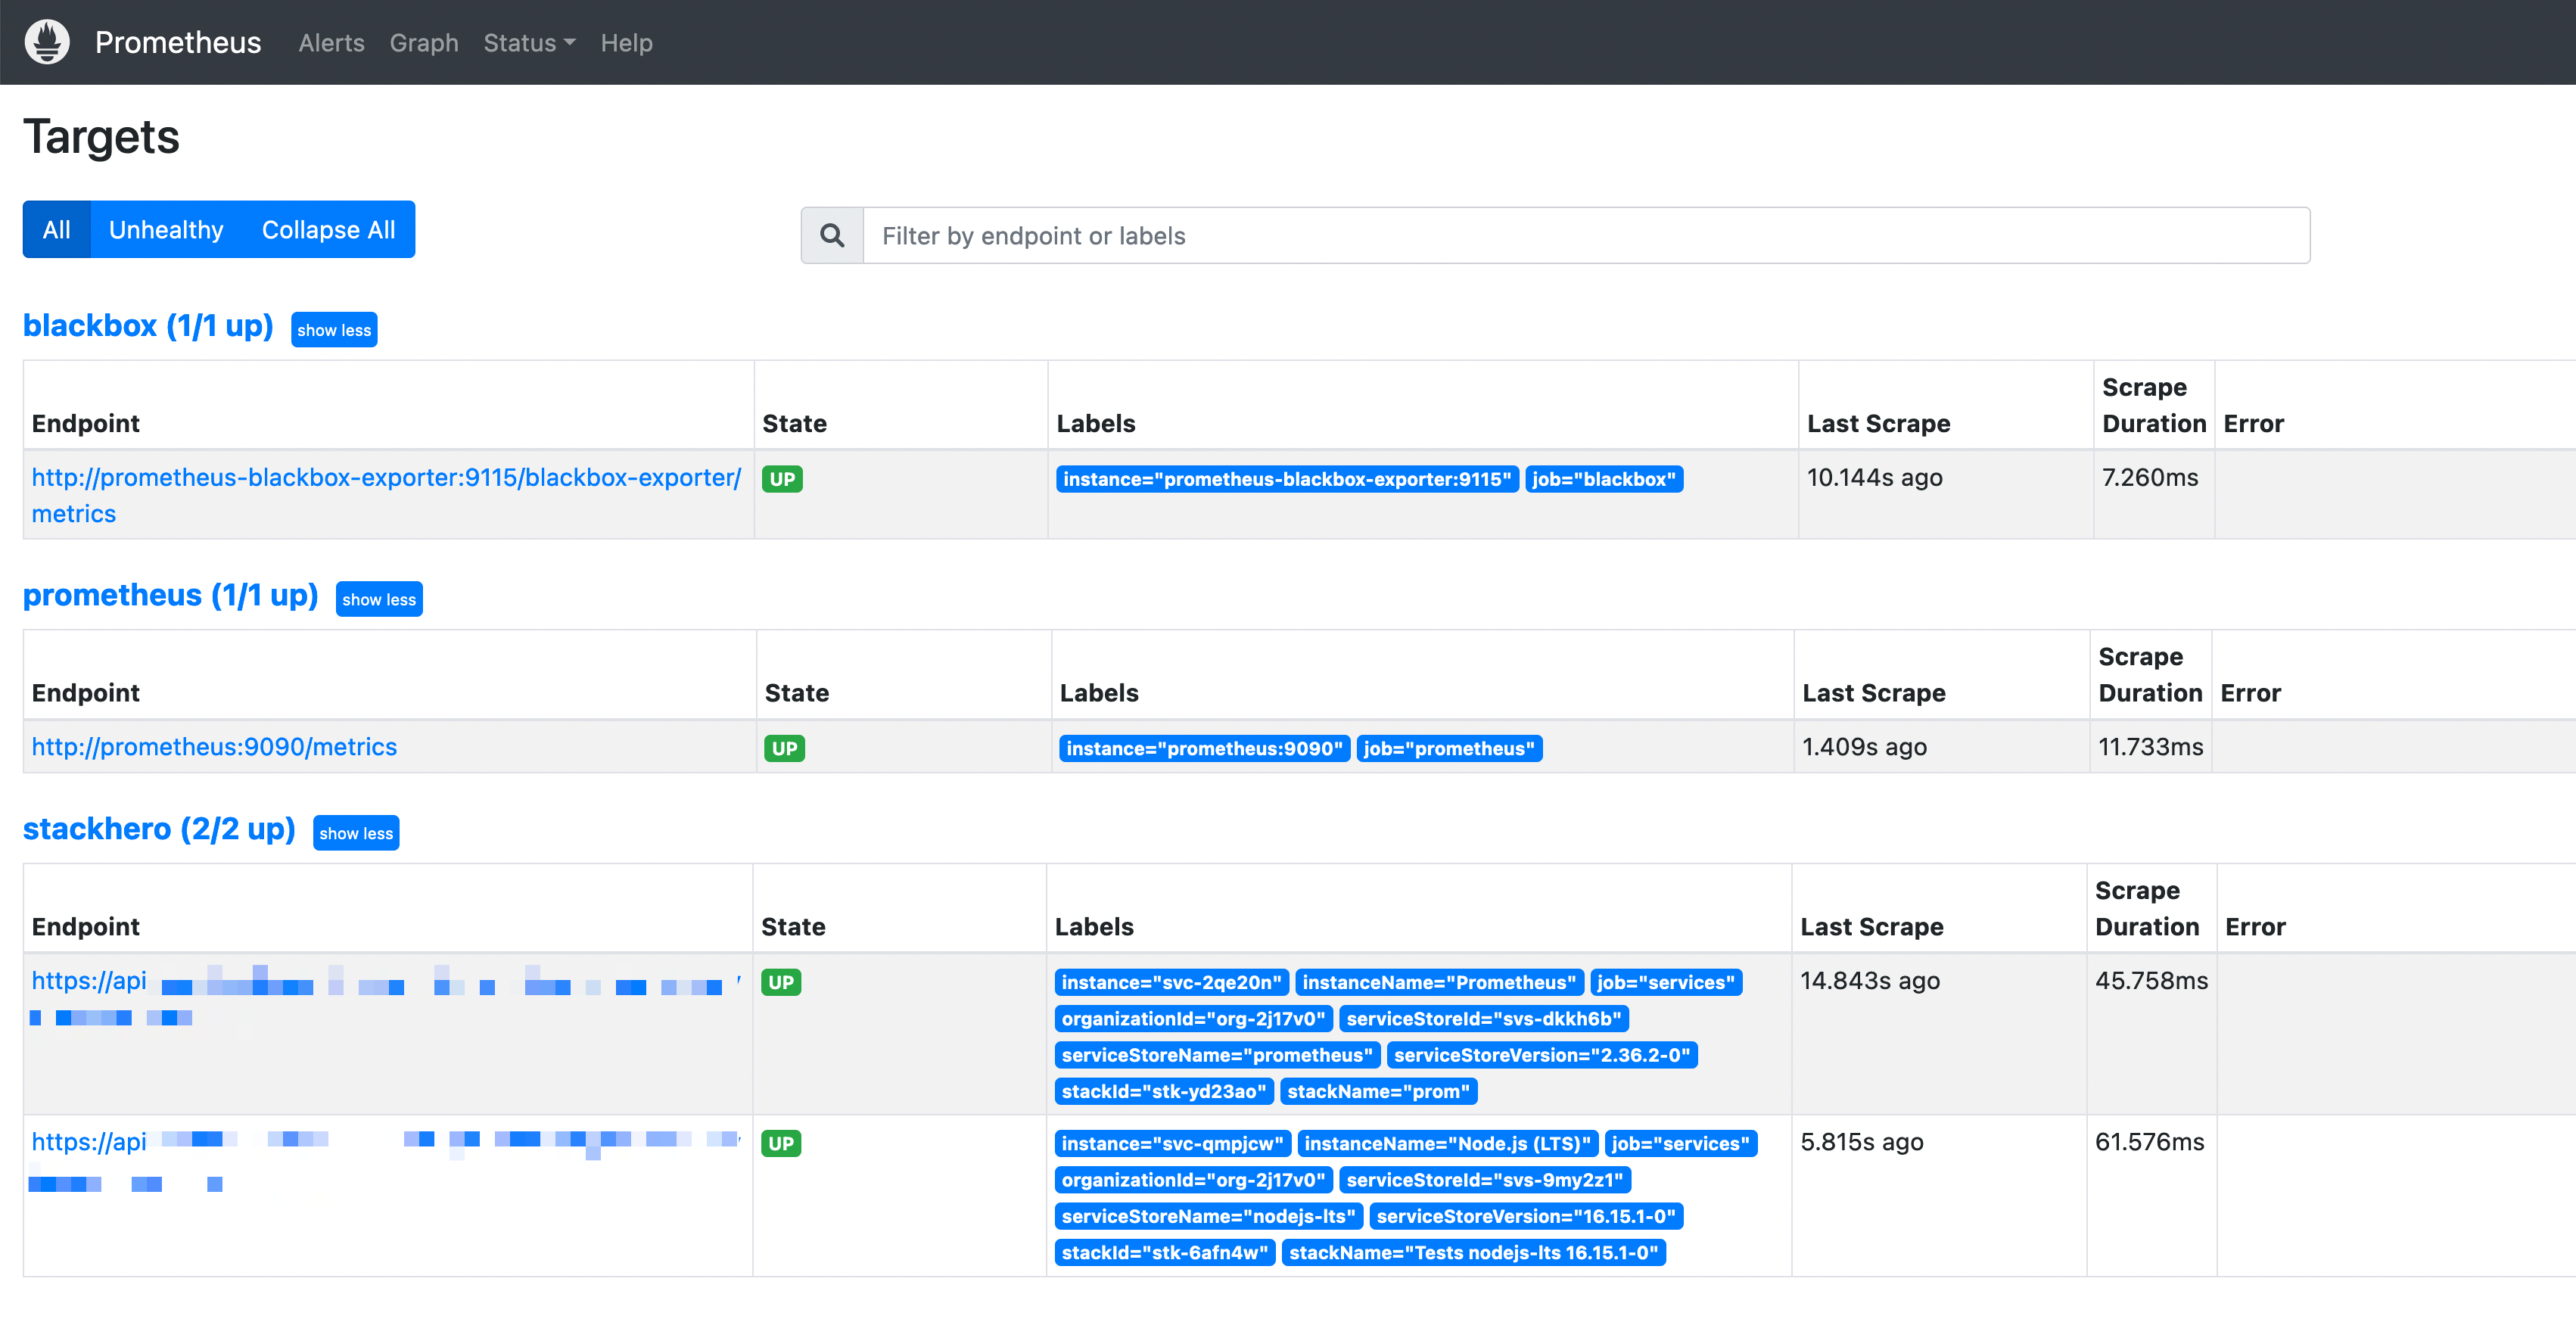 Prometheus dashboard showing Stackhero targets
Congratulations! Your Prometheus server now retrieves real-time metrics automatically for all your services.
4. Add a Grafana dashboard (optional)
Don't have a Grafana server yet? With Stackhero you can start a managed Grafana in just 2 minutes!
You can take advantage of a preconfigured dashboard in Grafana to display your instance metrics.
- In Grafana's web UI, go to
Create>Import. - In the
Import via grafana.comsection, set the ID to1860and click on theLoadbutton. - On the next page, select your Prometheus data source and click
Import.
Grafana will generate a dashboard that instantly displays the data retrieved from Prometheus!
Grafana dashboard showing an instance in real time
At the top left of the screen you can choose the instance you want to view by clicking on the host list.
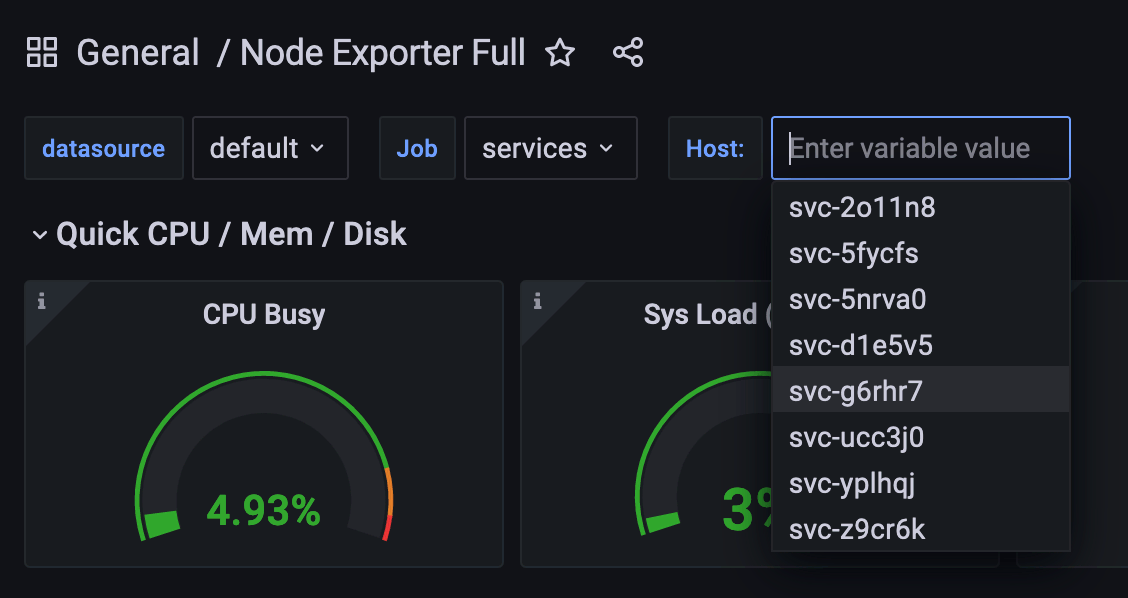 Selecting an instance in the "host" list
Congratulations, you can now monitor all your instances in real time!