 Prometheus: Retrieving metrics from Linux
How to retrieve Linux server metrics in Prometheus using Node Exporter
👋 Welcome to the Stackhero documentation!
Stackhero offers a ready-to-use Prometheus cloud solution that provides a host of benefits, including:
Alert Managerincluded to send alerts toSlack,Mattermost,PagerDuty, etc.- Dedicated email server to send unlimited email alerts.
Blackboxto probeHTTP,ICMP,TCP, and more.- Easy configuration with online configuration file editor.
- Effortless updates with just a click.
- Optimal performance and robust security powered by a private and dedicated VM.
Save time and simplify your life: it only takes 5 minutes to try Stackhero's Prometheus cloud hosting solution!
What is Prometheus Node Exporter
Node Exporter is software that you can install on *NIX kernels (Linux, OpenBSD, FreeBSD, or Darwin) to expose system metrics for Prometheus. It is an essential component for monitoring server performance and infrastructure health.
In Prometheus terminology, Node Exporter acts as an exporter and is added as a target in your Prometheus configuration. Prometheus connects to Node Exporter using TCP port 9100 via HTTP at regular intervals to retrieve metrics.
In summary, Node Exporter allows you to monitor a Linux-based system. For Windows systems, you can use the Windows Exporter.
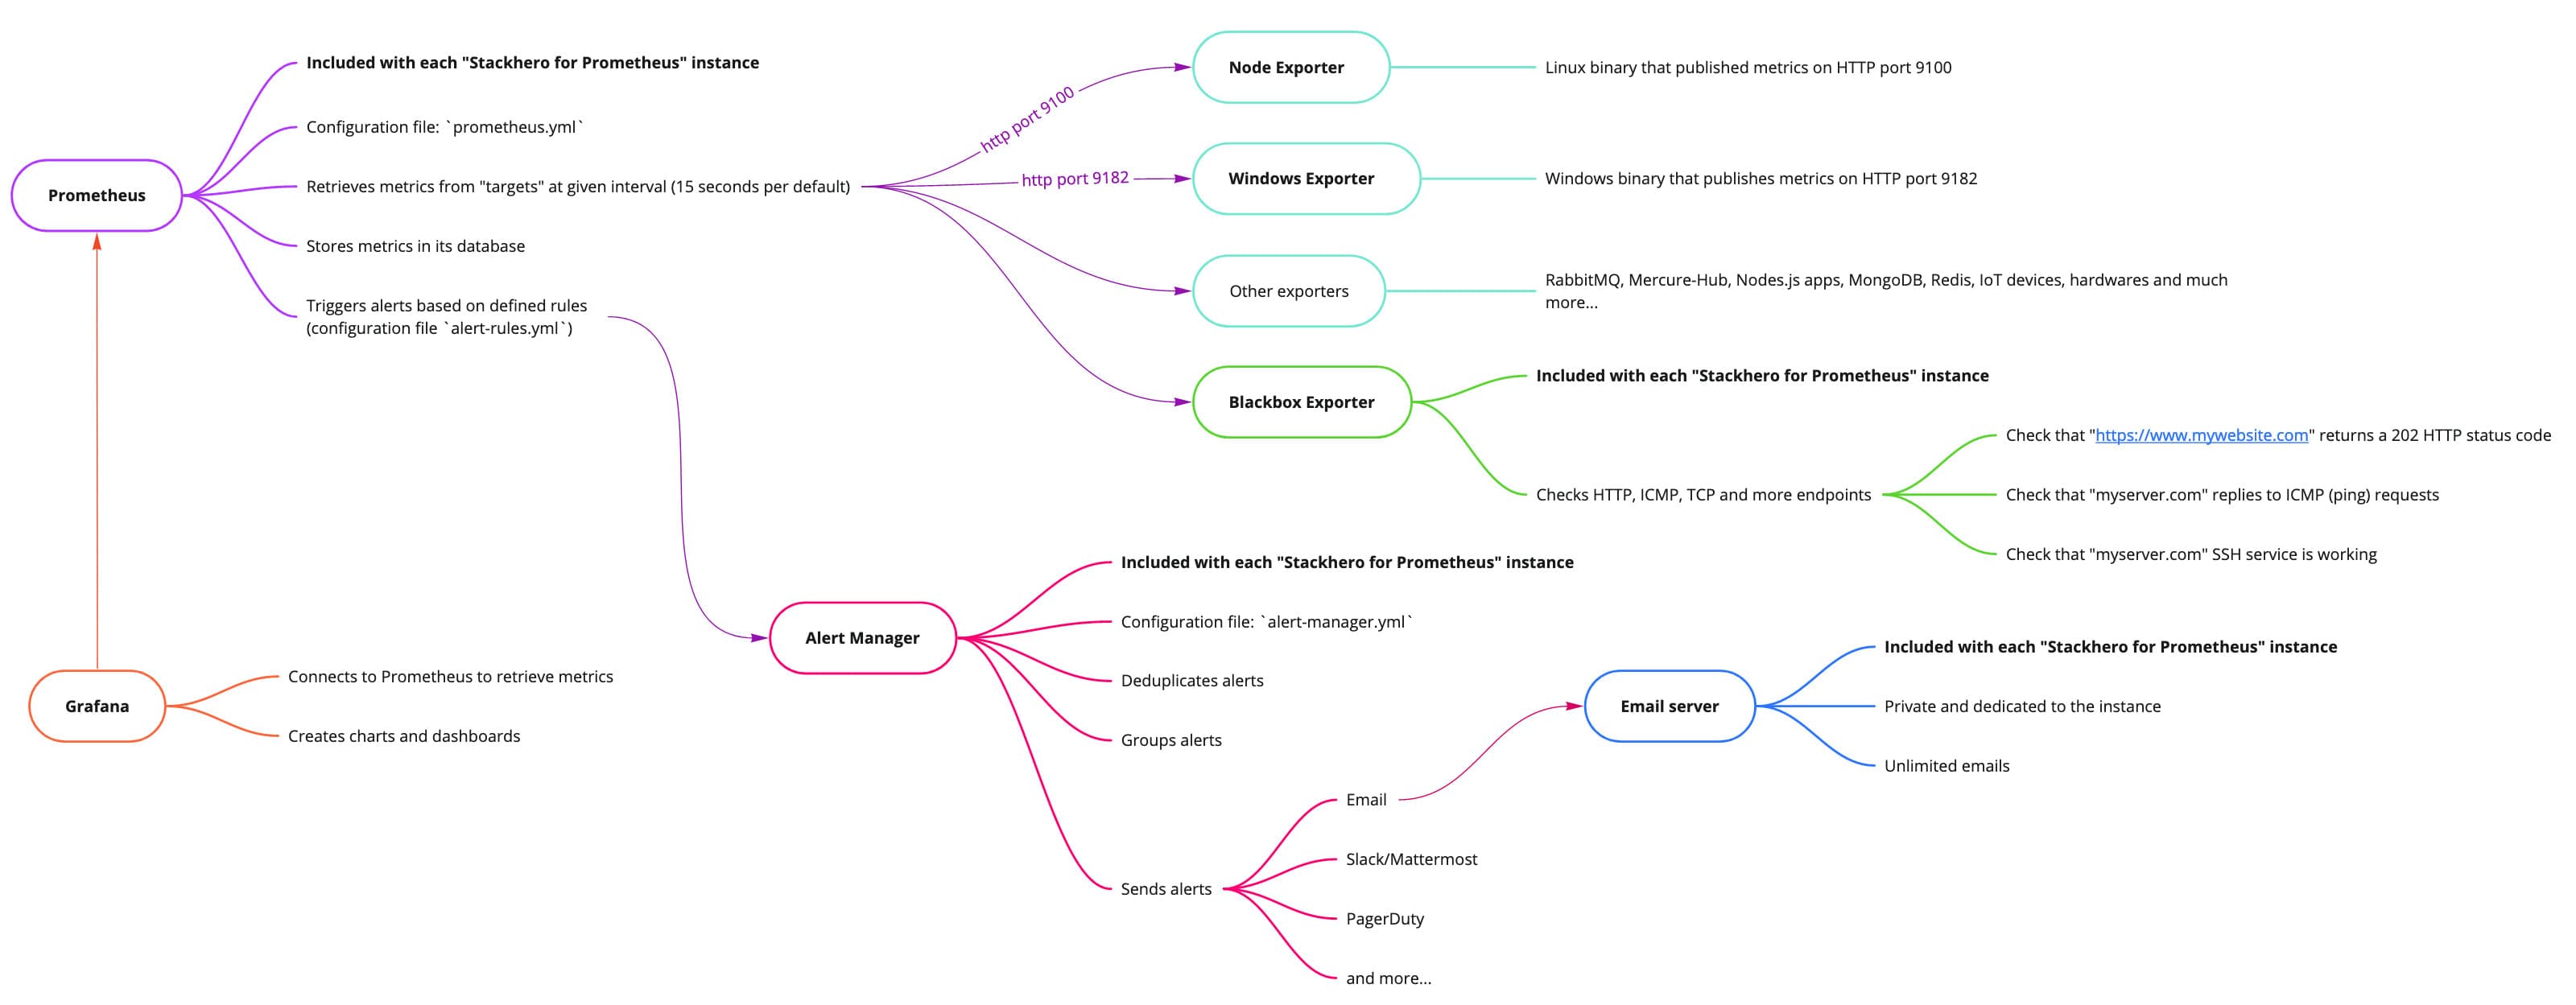 Big picture of Stackhero for Prometheus
Install Prometheus Node Exporter on a Linux server
You can download Node Exporter from its GitHub releases page. It is distributed as a binary that runs directly on your system. Because it is designed to run continuously, it is recommended that you configure it to launch automatically when your server boots.
By default, Node Exporter opens port 9100 to the world without authentication or encryption. It is highly recommended that you add both authentication and TLS encryption (see below) and set up a firewall to restrict access to port 9100 so that only your Prometheus server or other authorized IP addresses can connect.
How to install Prometheus Node Exporter on Ubuntu
You can follow these steps on Ubuntu:
# Go to https://github.com/prometheus/node_exporter/releases to get the latest version number.
node_exporter_version="1.2.0"
node_exporter_release="linux-amd64"

# Download and install node_exporter
cd /tmp
wget https://github.com/prometheus/node_exporter/releases/download/v${node_exporter_version}/node_exporter-${node_exporter_version}.${node_exporter_release}.tar.gz
tar xvfa node_exporter-${node_exporter_version}.${node_exporter_release}.tar.gz
sudo mv node_exporter-${node_exporter_version}.${node_exporter_release}/node_exporter /usr/local/bin/
rm -rf node_exporter-${node_exporter_version}.${node_exporter_release} node_exporter-${node_exporter_version}.${node_exporter_release}.tar.gz

# Create a user "node_exporter"
sudo useradd -rs /bin/false node_exporter

# Create a systemd service to start node_exporter automatically on boot
sudo bash -c 'cat << EOF > /etc/systemd/system/node_exporter.service
[Unit]
Description=Node Exporter
After=network.target

[Service]
User=node_exporter
Group=node_exporter
Type=simple
ExecStart=/usr/local/bin/node_exporter --web.config=/etc/prometheus_node_exporter/configuration.yml

[Install]
WantedBy=multi-user.target
EOF'

# Create a configuration directory and file
sudo mkdir -p /etc/prometheus_node_exporter/
sudo touch /etc/prometheus_node_exporter/configuration.yml
sudo chmod 700 /etc/prometheus_node_exporter
sudo chmod 600 /etc/prometheus_node_exporter/*
sudo chown -R node_exporter:node_exporter /etc/prometheus_node_exporter

sudo systemctl daemon-reload
sudo systemctl enable node_exporter

# Start the node_exporter daemon and check its status
sudo systemctl start node_exporter
sudo systemctl status node_exporter
At this point, the node_exporter binary should be running on your server. To confirm that it is working, you can connect to it and check if it returns metrics:
curl http://localhost:9100/metrics
Node Exporter opens port 9100 to the public network. This means that anyone can connect and retrieve your server metrics! At a minimum, you should add authentication and TLS encryption (see below) and it is strongly recommended to set up a firewall to block requests to port 9100 from IPs other than your Prometheus server.
How to install Prometheus Node Exporter on Debian
The installation process for Node Exporter on Debian is identical to the Ubuntu method described above. Simply follow the same instructions.
How to install Prometheus Node Exporter on other systems
The installation steps for Node Exporter depend on the system you use. While detailed documentation for every platform is not provided, the basic procedure involves downloading the binary that matches your system and configuring it to start on boot.
Add authentication to Prometheus Node Exporter
By default, Node Exporter does not perform authentication, meaning anyone can retrieve the exposed metrics. To secure access, you can add basic authentication for a user.
Generating a random password
Generate a password using the following commands:
password=`openssl rand -base64 32`
passwordHashed=`echo ${password} | htpasswd -inBC 10 "" | tr -d ':'`
echo "Clear password to keep for Prometheus server: ${password}"
If you do not have the
htpasswdbinary, you can install it on Debian/Ubuntu usingapt-get install --no-install-recommends apache2-utils.
Keep the clear password secure as you will need it when configuring Prometheus.
Adding the user and restarting Node Exporter
Append the following lines to the configuration file to add a user called "prometheus" with the generated password hash:
sudo cat << EOF >> /etc/prometheus_node_exporter/configuration.yml
basic_auth_users:
  prometheus: ${passwordHashed}

EOF

# Restart Node Exporter
sudo systemctl restart node_exporter
Finally, verify that authentication is working correctly:
- Running
curl http://localhost:9100/metricsshould return "Unauthorized". - Running
curl -u prometheus:${password} http://localhost:9100/metricsshould return the list of metrics.
Add TLS encryption to Prometheus Node Exporter
By default, Node Exporter does not encrypt communications. This means that credentials, including the previously defined password, are transmitted in plain text. To secure communications, you can enable TLS encryption as follows.
Creating TLS certificates
Run the following commands to create a TLS certificate and key:
# Create TLS certificate
cd /tmp
sudo openssl req -new -newkey rsa:2048 -days 3650 -nodes -x509 \
  -keyout /etc/prometheus_node_exporter/tlsCertificate.key \
  -out /etc/prometheus_node_exporter/tlsCertificate.crt \
  -subj "/CN=`hostname`" \
  -addext "subjectAltName = DNS:`hostname`"
sudo chmod 600 /etc/prometheus_node_exporter/*
sudo chown -R node_exporter:node_exporter /etc/prometheus_node_exporter
Updating the configuration
Append the following lines to the configuration file to add TLS settings and then restart Node Exporter:
sudo cat << 'EOF' >> /etc/prometheus_node_exporter/configuration.yml
tls_server_config:
  cert_file: /etc/prometheus_node_exporter/tlsCertificate.crt
  key_file: /etc/prometheus_node_exporter/tlsCertificate.key

EOF

# Restart Prometheus Node Exporter
sudo systemctl restart node_exporter
You can verify that TLS is active by connecting via HTTPS with the following command:
curl -k -u prometheus:${password} https://localhost:9100/metrics
Note that this method does not use a CA certificate, so you need to pass the "-k" option to cURL to bypass certificate verification.
Configure Prometheus server to scrape data from Node Exporter
After installing Node Exporter and securing it, configure your Prometheus server to scrape metrics on a regular schedule.
On Stackhero, select your Prometheus service and go to the "Prometheus configuration" URL. Then add the following to your scrape_configs section:
scrape_configs:

  - job_name: "My servers pool"
    static_configs:
      - targets: [ "<yourLinuxServerDomain>:9100" ]
    basic_auth:
      username: "prometheus"
      password: "<password>"
    scheme: https
    tls_config:
      insecure_skip_verify: true
    # Relabeling "instance" to remove the ":9100" part
    relabel_configs:
      - source_labels: [__address__]
        target_label: instance
        regex: '([^:]+)(:[0-9]+)?'
        replacement: '${1}'
Save the file and check your Prometheus logs to confirm that it has reloaded successfully (you can view the logs from the Stackhero dashboard by selecting your Prometheus service and clicking on the "Logs" tab).
Finally, verify that Prometheus is scraping metrics by accessing the Prometheus UI on the Stackhero dashboard and navigating to Status > Targets. Your Linux server should appear in the target list as UP.
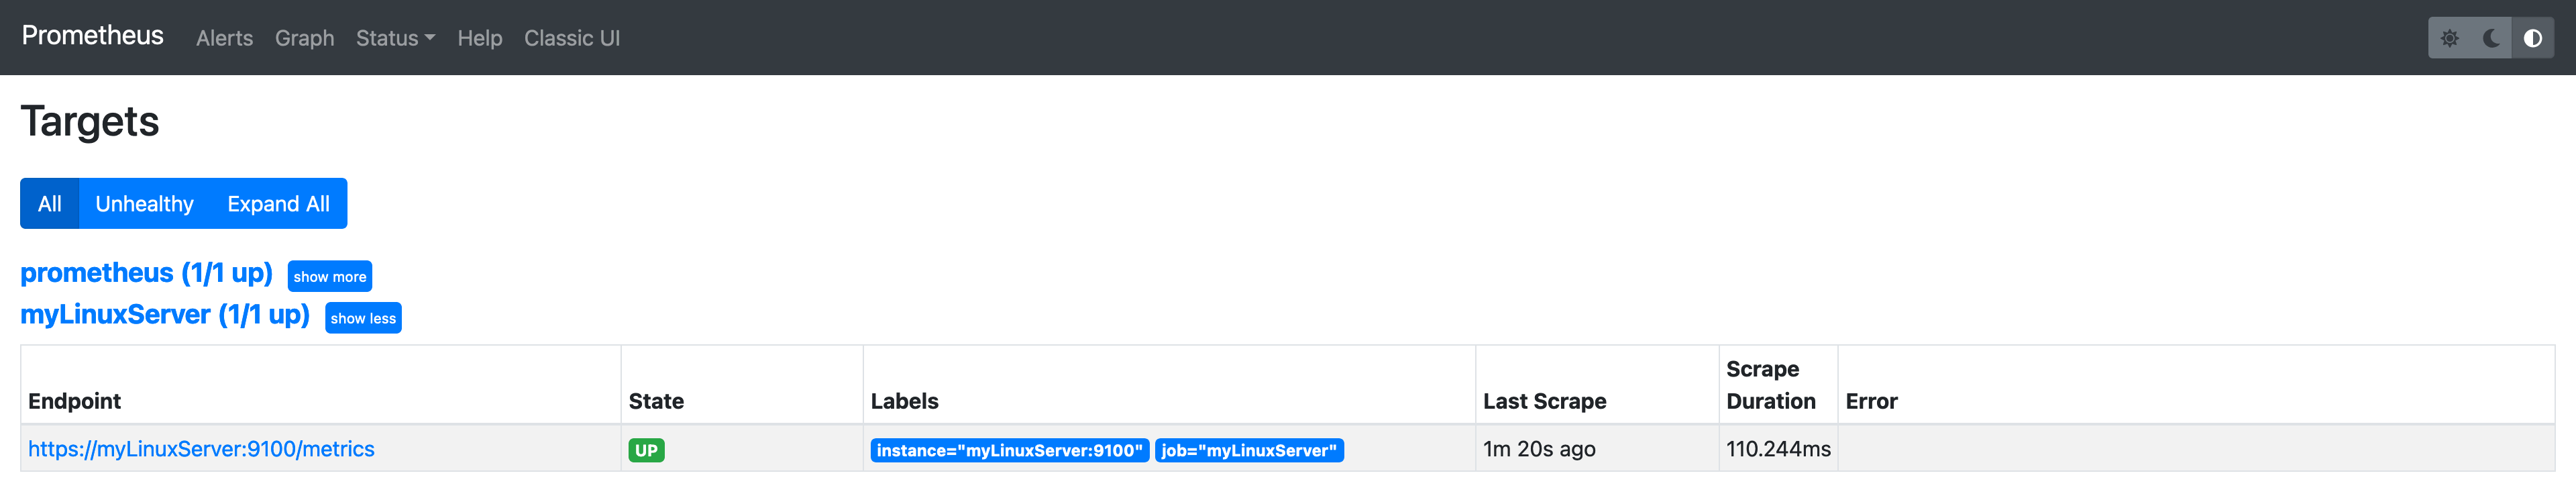 The target "myLinuxServer" is UP
Show data on Prometheus
To view the metrics retrieved from Node Exporter, log in to Prometheus via the Stackhero dashboard using the "Prometheus UI" URL or directly at https://<prometheusDomain>/.
In the "Expression" field, type node_memory_MemTotal_bytes and press enter. If everything is configured correctly, you will see the server's total RAM displayed in bytes.
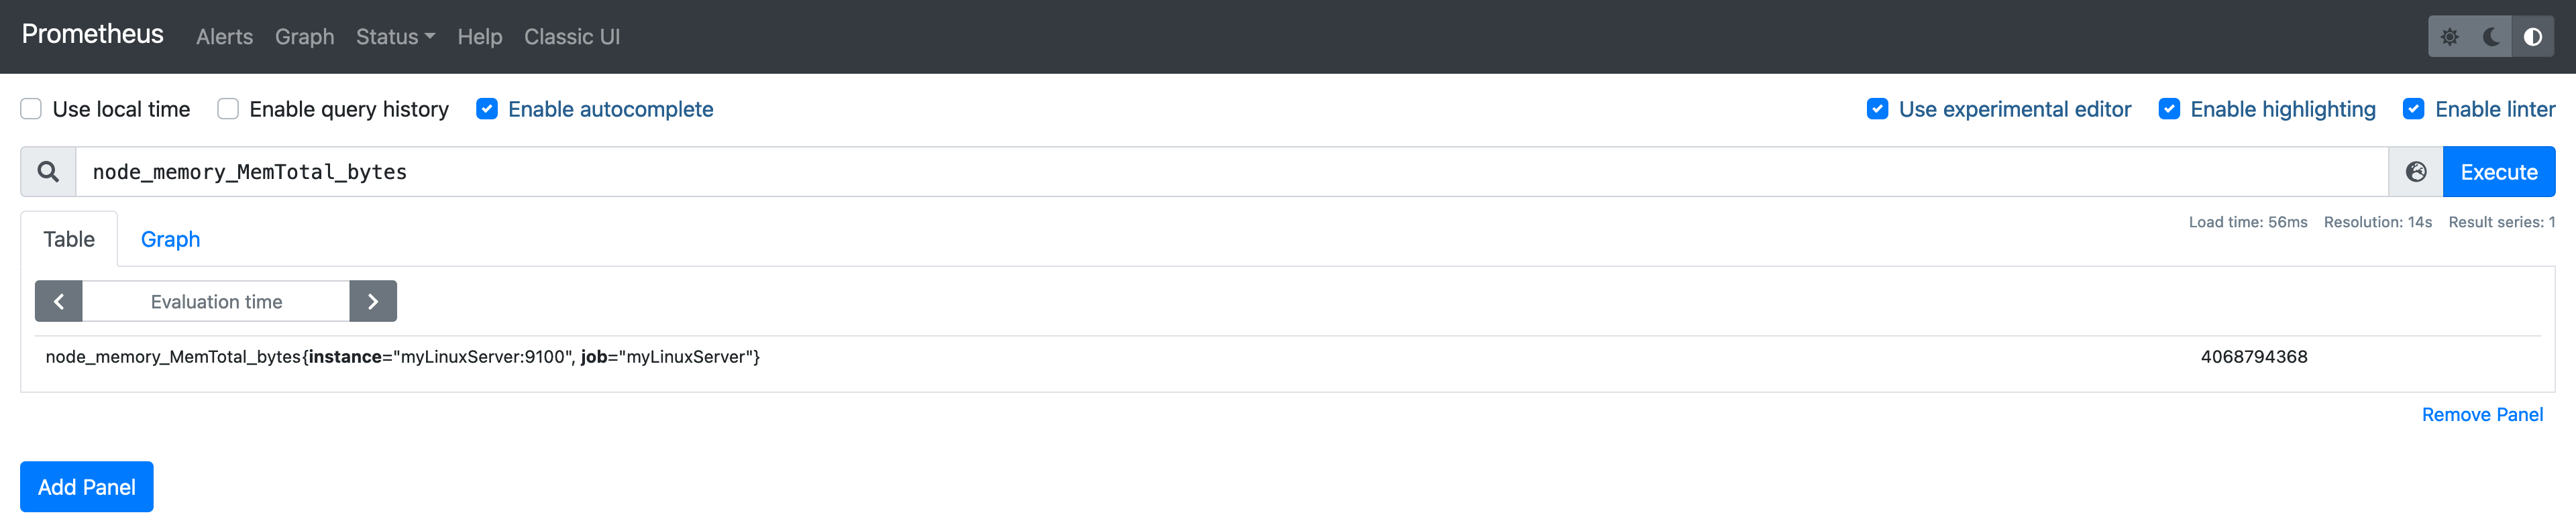 The total amount of RAM for this server is 4068794368 bytes which is 3.78GB
Configure Grafana to show Prometheus data retrieved from Node Exporter
Grafana can generate dashboards effortlessly based on Prometheus data. For detailed instructions on configuring Grafana to display Prometheus data, please refer to Grafana's documentation.
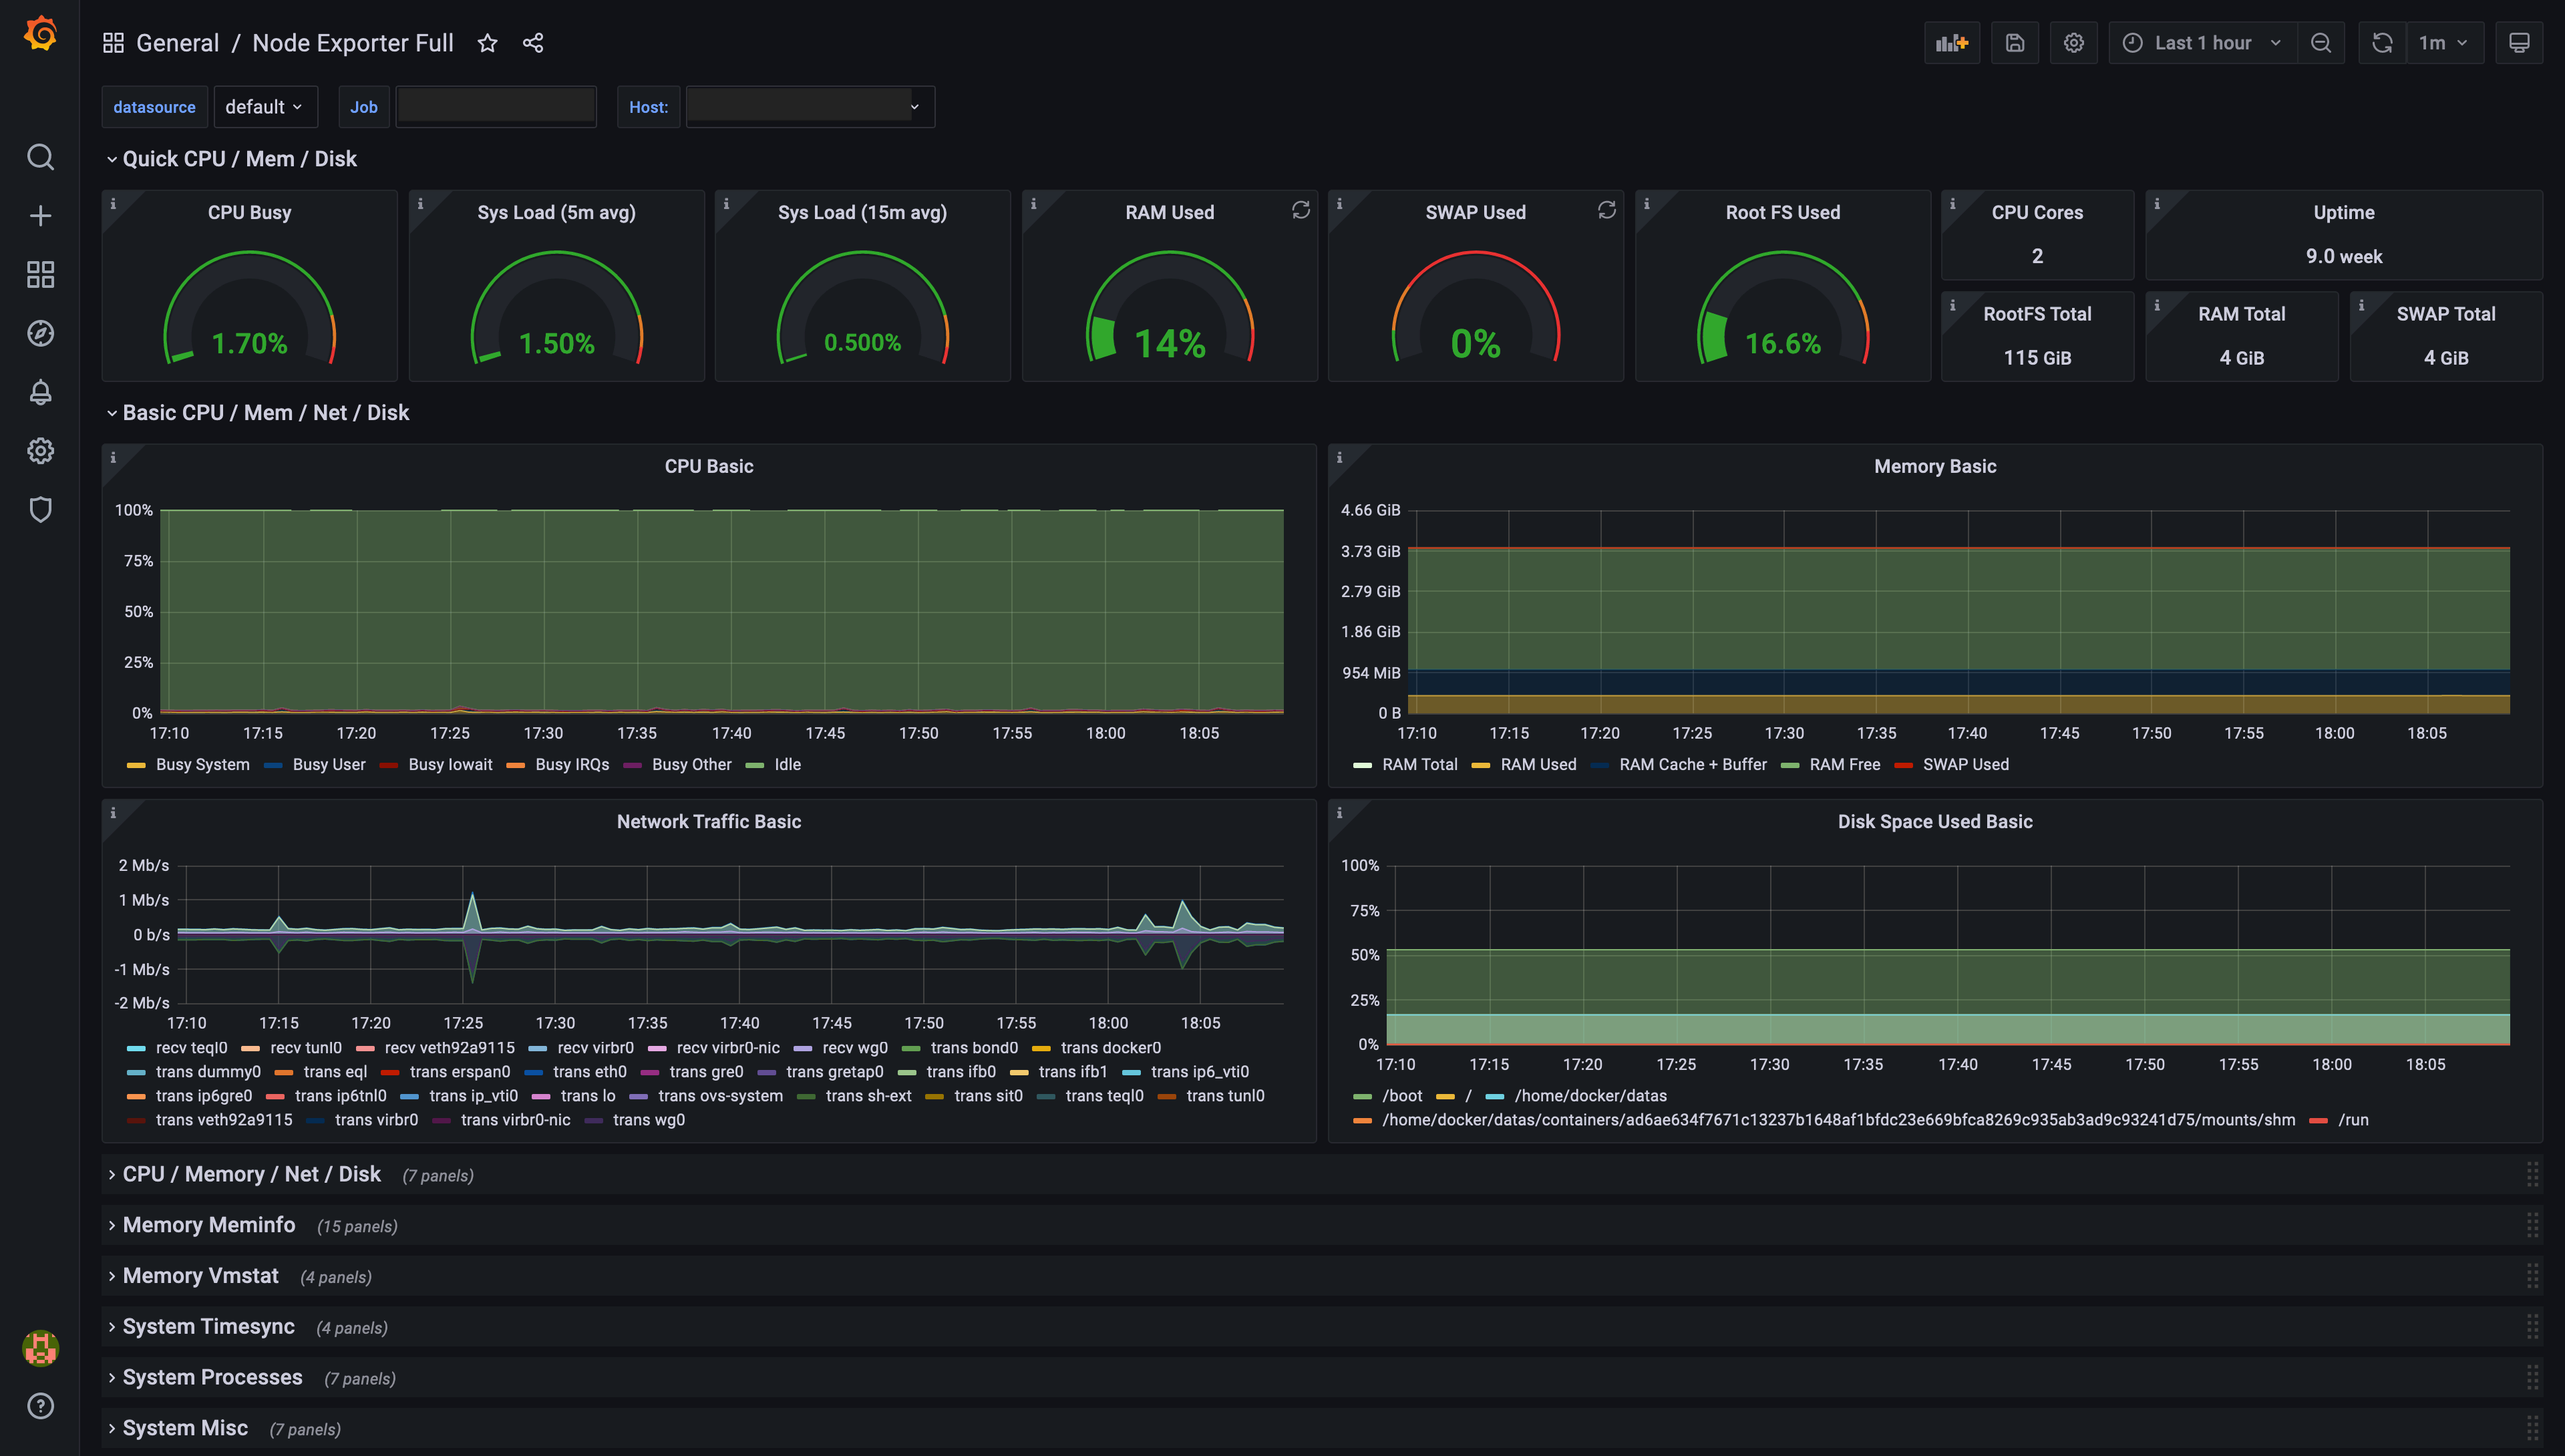 Example of a dashboard generated by Grafana, based on Prometheus Node Exporter data