 Prometheus: Blackbox Exporter
How to use Prometheus Blackbox Exporter to probe HTTP and ICMP (ping) endpoints
👋 Welcome to the Stackhero documentation!
Stackhero offers a ready-to-use Prometheus cloud solution that provides a host of benefits, including:
Alert Managerincluded to send alerts toSlack,Mattermost,PagerDuty, etc.- Dedicated email server to send unlimited email alerts.
Blackboxto probeHTTP,ICMP,TCP, and more.- Easy configuration with online configuration file editor.
- Effortless updates with just a click.
- Optimal performance and robust security powered by a private and dedicated VM.
Save time and simplify your life: it only takes 5 minutes to try Stackhero's Prometheus cloud hosting solution!
Introduction to Prometheus Blackbox Exporter
The Prometheus Blackbox Exporter is a powerful tool that allows you to probe endpoints using various protocols, including HTTP, HTTPS, DNS, TCP, and ICMP. This flexibility enables comprehensive monitoring of different aspects of your infrastructure and services.
For example, when probing HTTP and HTTPS endpoints, you can:
- Verify website availability by checking for a 2xx HTTP status code.
- Ensure specific content is returned, such as matching a webpage title to the expected text.
- Validate TLS certificates by retrieving their expiration dates, helping you prevent unexpected renewal issues.
- Measure performance by assessing DNS resolution times and the duration of the TLS handshake.
Using ICMP, you can confirm that servers respond to ping requests and measure their response times. Additionally, DNS probing provides insights into reply timings, while TCP probing lets you connect to a service to verify the content and version of an SSH server banner.
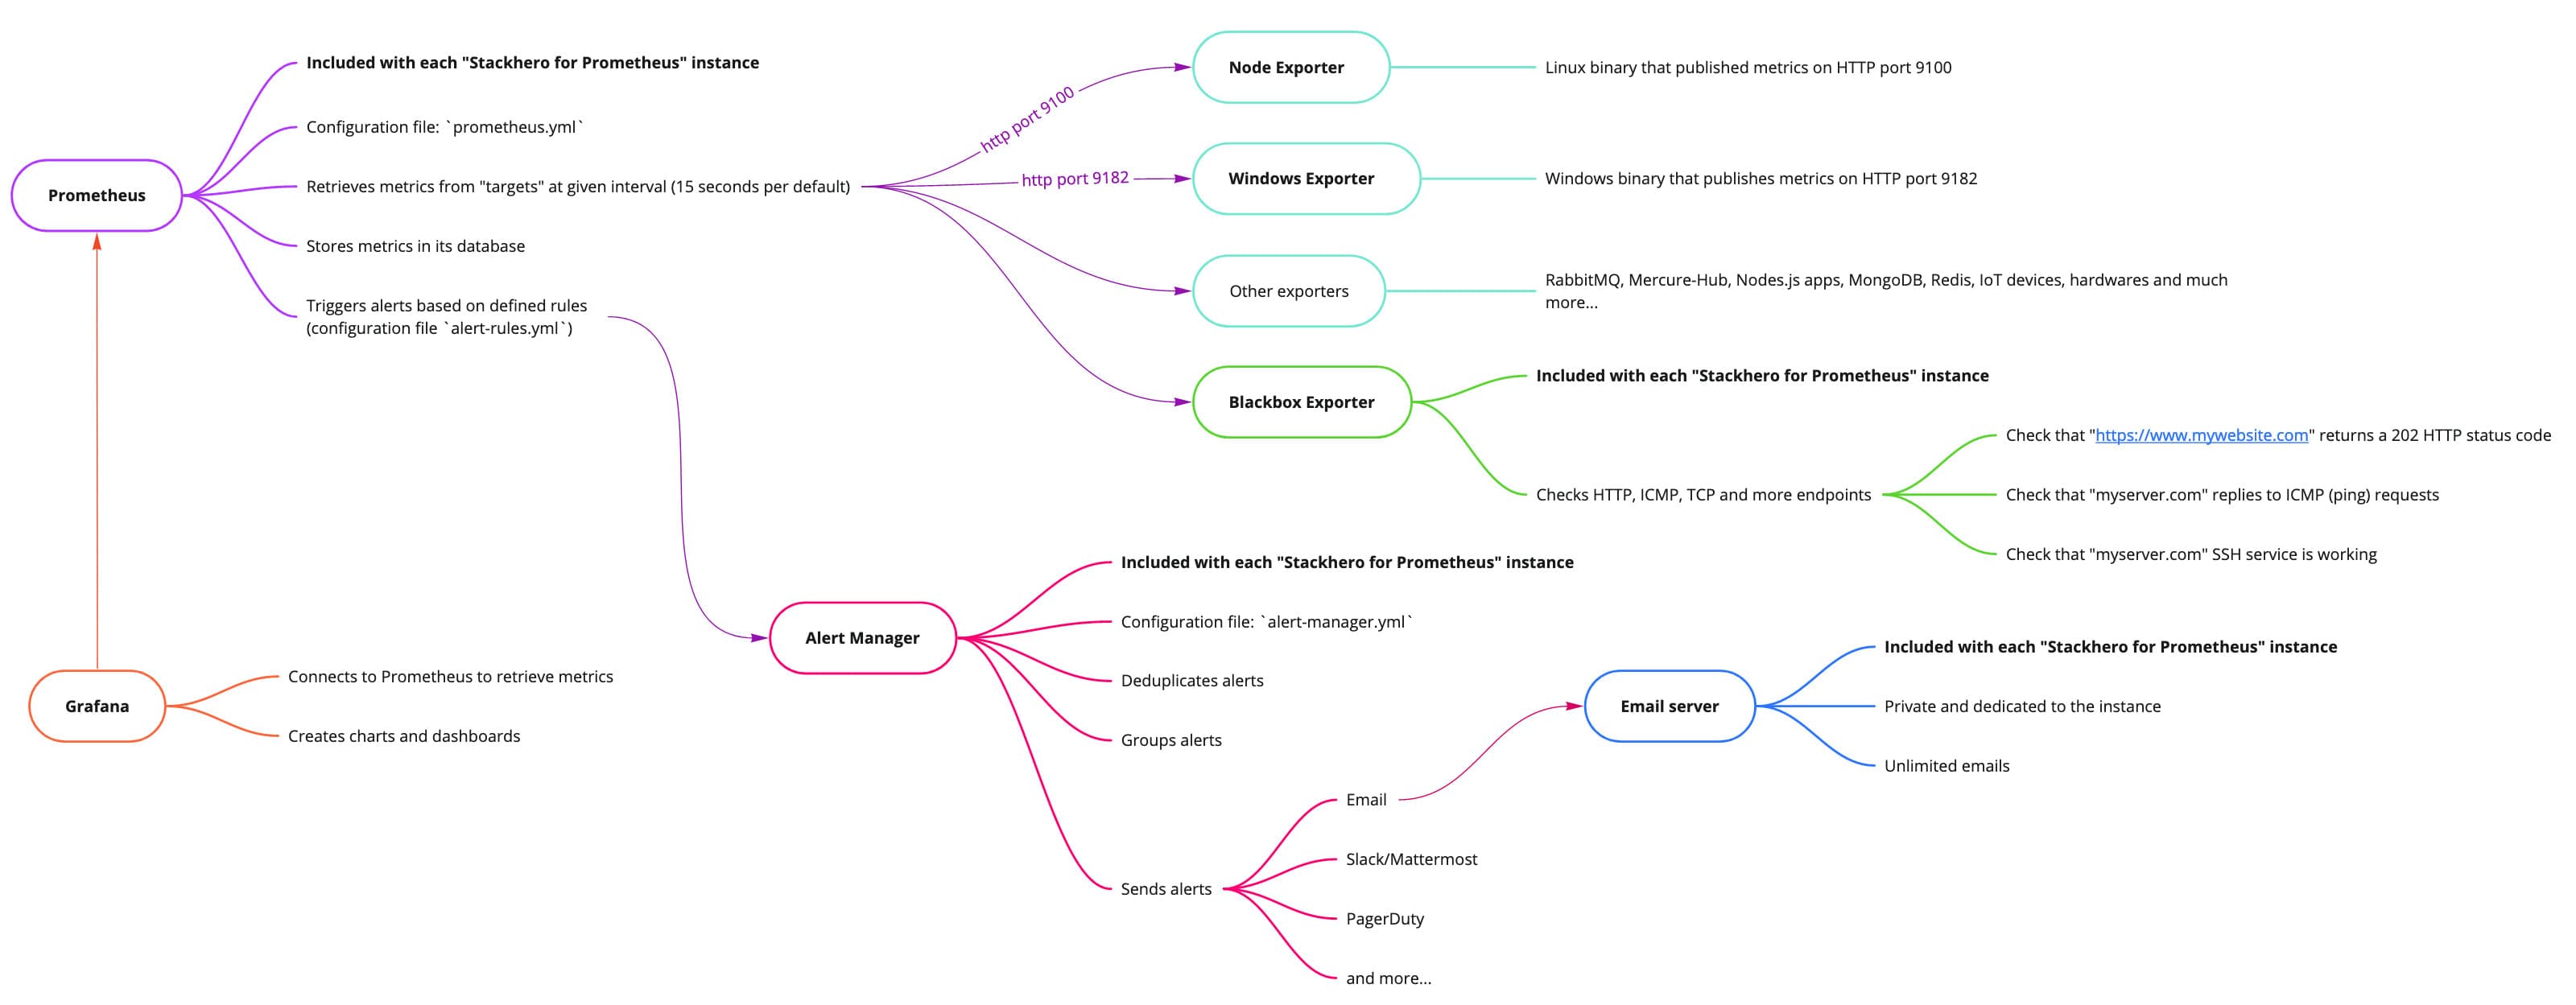 Big picture of Stackhero for Prometheus
Prometheus Blackbox Exporter configuration
Setting up the Blackbox Exporter involves working with two key files: blackbox-exporter.yml for core settings and prometheus.yml to define how Prometheus scrapes data from the exporter.
Configuring the Blackbox Exporter core
The core configuration, found in the blackbox-exporter.yml file, specifies which protocols to support and how they should be monitored.
On Stackhero for Prometheus, this file is preconfigured to support both ICMP monitoring and HTTP/HTTPS monitoring (via GET and POST requests) right out of the box. If you need to tailor this file for more advanced scenarios, you can check out configuration examples in the Blackbox Exporter repository and consult the official documentation for further guidance.
Configuring the Prometheus Blackbox Exporter target
Most of your configuration will take place in the prometheus.yml file, where you instruct Prometheus to scrape data from the Blackbox Exporter like any other exporter.
For instance, consider the configuration below that checks ICMP (ping) responses from prometheus.io and grafana.com every 15 seconds (as defined by the scrape_interval). You can add this block to your prometheus.yml file within the scrape_configs section and update the targets array with the domain names or IP addresses you wish to monitor:
  - job_name: "blackbox-icmp"
    metrics_path: "/blackbox-exporter/probe"
    params:
      module: [ "icmp" ]
    relabel_configs:
      - source_labels: [ "__address__" ]
        target_label: "__param_target"
      - source_labels: [ "__param_target" ]
        target_label: "instance"
      - target_label: "__address__"
        replacement: "prometheus-blackbox-exporter:9115"
    static_configs:
      - targets: [ "prometheus.io", "grafana.com" ]
Similarly, the configuration below monitors HTTP servers. In this setup, if the HTTP response status is not in the 2xx range, the target is flagged as erroneous. You can insert this block into your prometheus.yml file under the scrape_configs section and update the targets array with the URLs you wish to monitor:
  - job_name: "blackbox-http"
    metrics_path: "/blackbox-exporter/probe"
    params:
      module: [ "http_2xx" ]
    relabel_configs:
      - source_labels: [ "__address__" ]
        target_label: "__param_target"
      - source_labels: [ "__param_target" ]
        target_label: "instance"
      - target_label: "__address__"
        replacement: "prometheus-blackbox-exporter:9115"
    static_configs:
      - targets: [ "https://prometheus.io/", "https://grafana.com/" ]
Once your scrape jobs are configured, you can review debug logs in the Blackbox UI. The link to the UI is available on your Stackhero dashboard, offering valuable insights into the probe results.
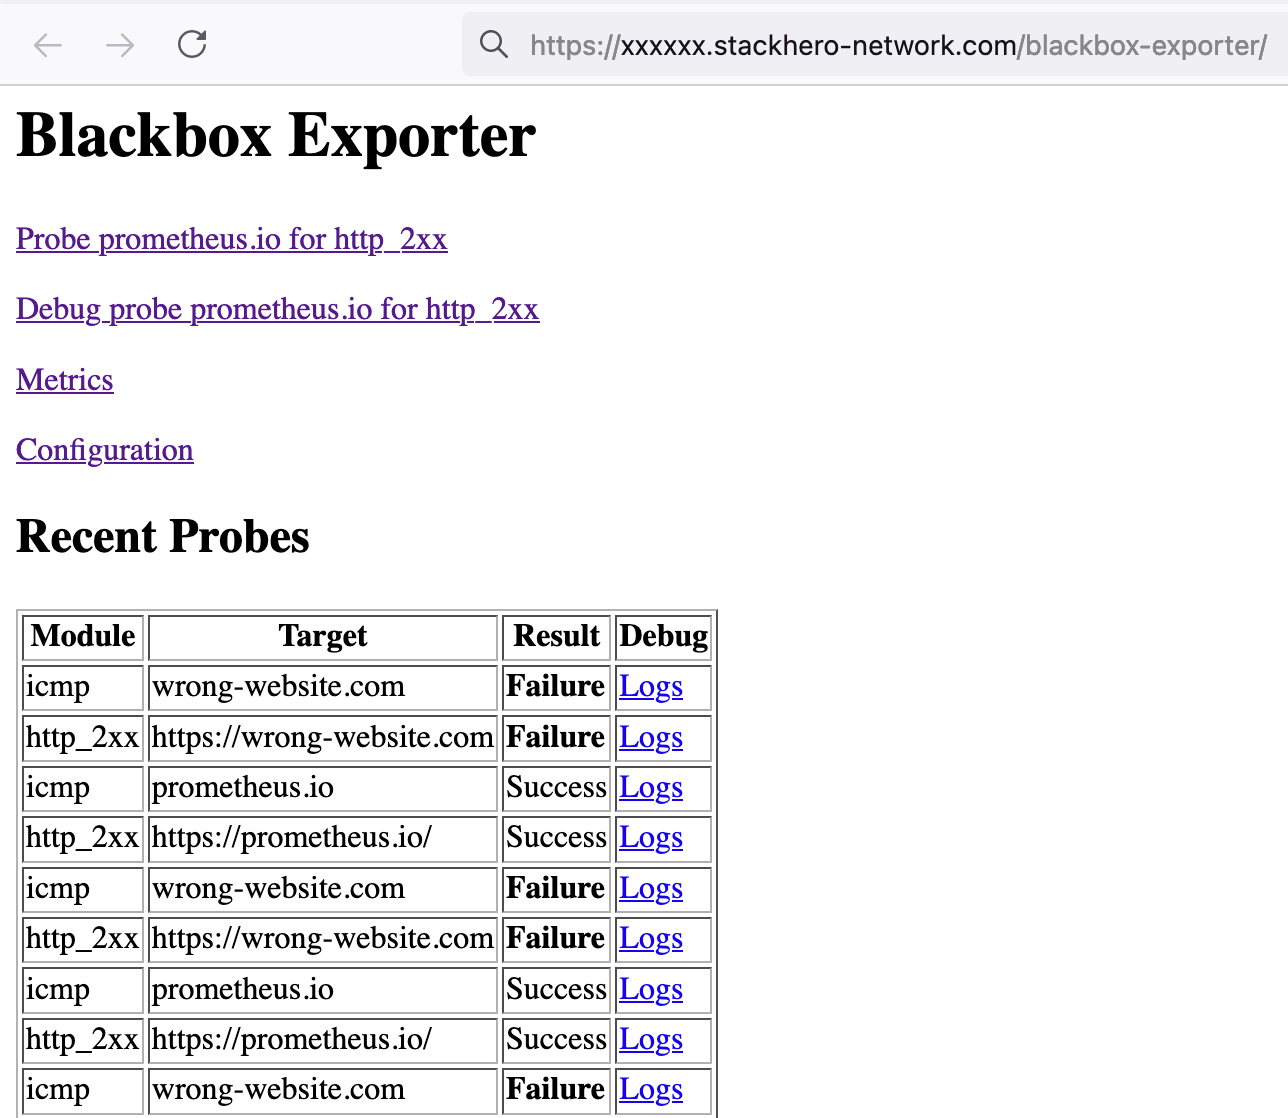 Blackbox UI showing the results of the last scrapes
Configuring Grafana to display Prometheus data from the Blackbox Exporter
Grafana makes it easy to create dashboards that visualize the performance and availability metrics collected by the Blackbox Exporter. With just a few clicks, you can set up dynamic dashboards that bring your Prometheus data to life. For more details on integrating Grafana with Prometheus, you might explore Grafana's documentation.
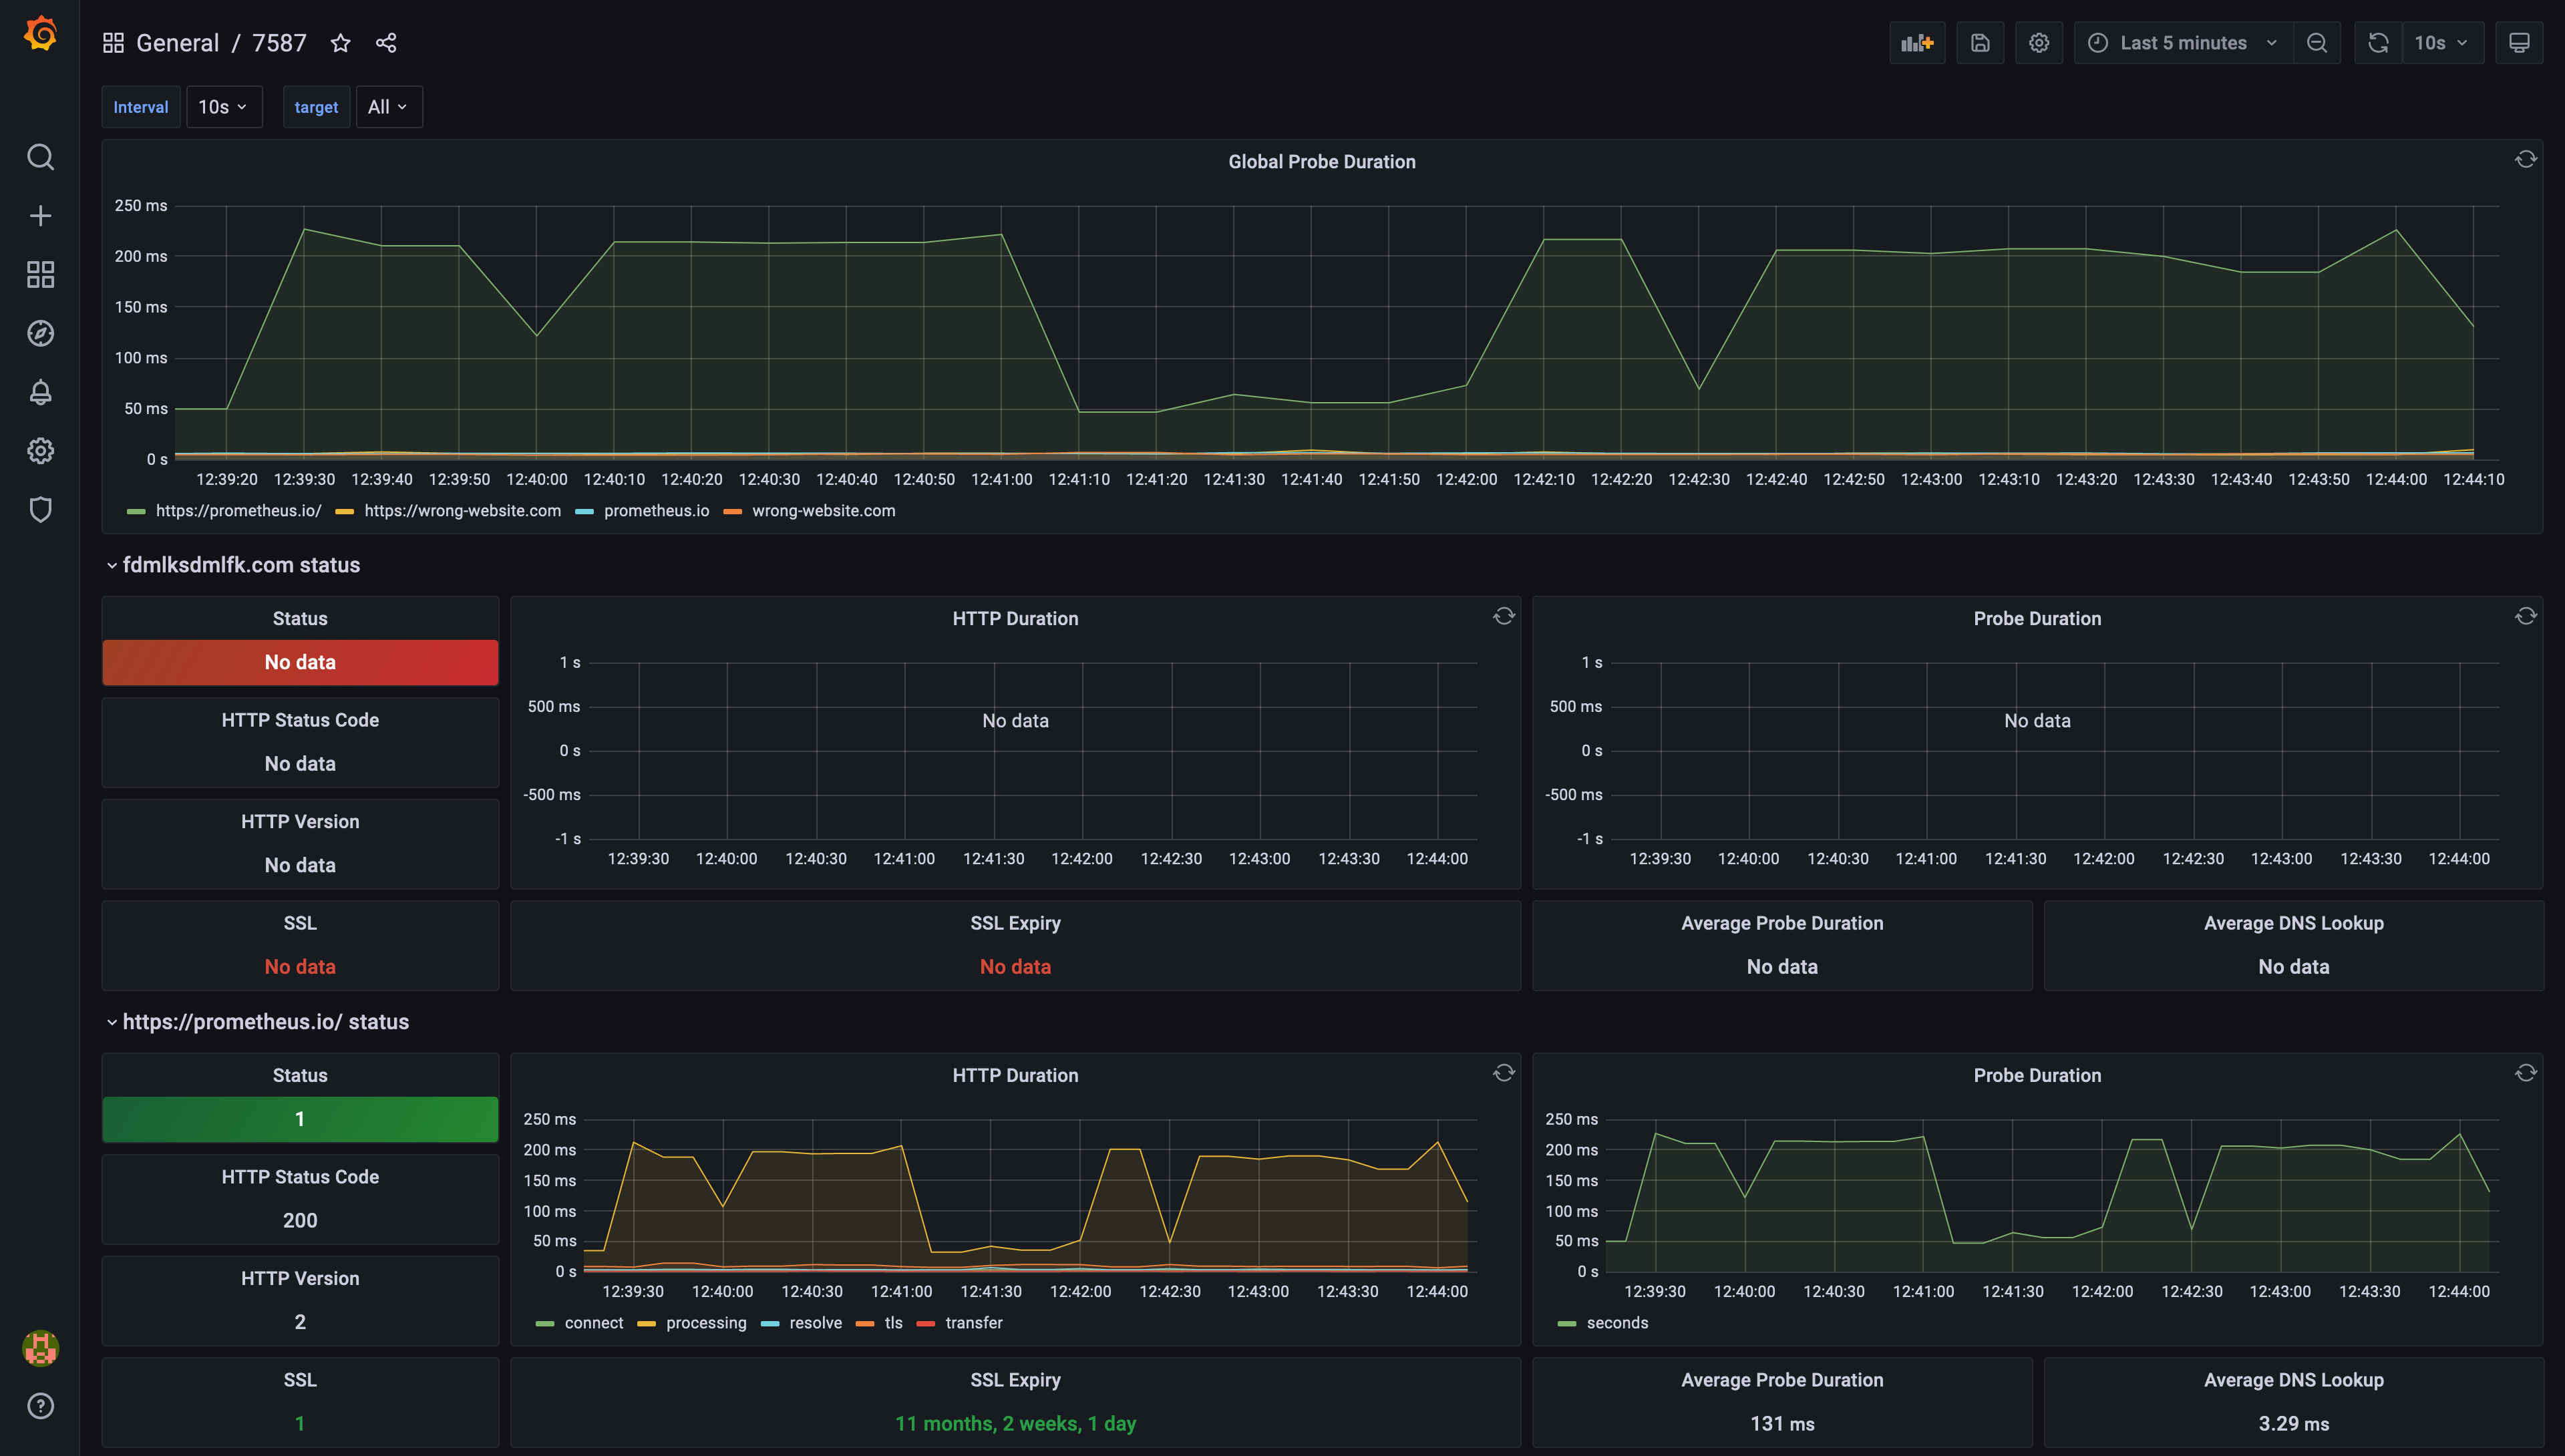 Example of a dashboard generated by Grafana, based on Prometheus Blackbox Exporter data